

Bringing Real-World Relevance to the Classroom Through “Tracker” Software
Written by: Bo Gibson
Mathematics is everywhere. It is all around us at all times. However, as math teachers, it is sometimes difficult to bring that math to the surface so that it is visible to the average student. Sure, there is mathematics in those contrived “real-word problems” that reside in the back of the problem sets of each section or chapter, but how do we convince students that there is mathematics underlying their everyday interactions with the world? Of course, there are many ways to make these underlying mathematical relationships visible to students, but we are fortunate enough to live in a time where free and (relatively) easy-to-use software is readily available to help educators and students begin to see these relationships. Tracker, a free video analysis and modeling tool that originally was meant for physics educators, can be an extraordinarily helpful tool for teachers of all STEM subjects to bring out the mathematical relationships in everyday interactions. With the help of Tracker software, students can record a video of any phenomenon with their cell phones or any other device that can record video, upload their video into the software, and almost immediately begin to get mathematical data from their video. No longer do STEM teachers have to rely on those tired problems from the textbook where “Little Johnny throws a ball whose path can modeled by h = -16t2 + 48t + 5…”. With the help of Tracker software, you can take the class outside, have students film a literal ball being thrown through the air, and the students can develop the mathematical model for themselves! Videos imported into Tracker software can be annotated, analyzed, and Tracker will give a variety of graphical displays to describe the video. Tracker can output displacement, velocity, acceleration in the x or y axis (or give the overall magnitude of the respective quantity), momentum, energy graphs and even has several more options for graphical outputs. Almost any physical quantity you can hope to investigate can be analyzed with the Tracker software. Graphical outputs are awesome, but what I absolutely love about the software is that it gives data in multiple ways. Along with the graph will be a spreadsheet with the same data displayed numerically for students to compare the trends they see numerically to the visual display given in the graph. AND to add to the fun, Tracker will also give a best-fit equation to have a third way to look at the data. Whatever phenomenon is being investigated, students can see it through three different mathematical perspectives! Physics teachers may already be well-versed in this awesome free software, but I’ve had a lot of success employing it in my math and engineering classes as well. Here’s just a few ideas on how to use the software outside of a physics classroom.
Idea #1 (Algebra 1 or 2)
A fun activity to investigate quadratic functions in an Algebra 1 or 2 class is to go out on the football field and have students kick field goals. Record a video and have students track the flight of the ball. The ball’s path will be described by a quadratic function. Students can use Tracker to find an equation to model the path, find its highest point, find when/where the ball would hit the ground, etc. In the past, I’ve made sure the videos were recorded so that the full path of the ball was not recorded. Students measure where the ball lands and then compare the actual results to what their equations/graphs predict. An added bonus to this activity is that the ball’s velocity in the vertical direction will decrease linearly with time! If you were so inclined, you could reinforce linear function concepts while you primarily investigate quadratics.
Idea #2 (Algebra 2 or Pre-Calculus)
Another fun example you could use to visually demonstrate a horizontal asymptote is to have students record a video of an RC car taking off and reaching its top speed. As students track the car’s motion, they should notice the velocity function has something very similar to a horizontal asymptote at its max speed. Keep in mind that in reality a rational function would not give us a perfect model of the situation! However, I’ve found that having this physical analogy for an asymptote is really beneficial for some students. Also, this brings up a good opportunity to have a discussion with students about acknowledging the limitations of our mathematical models.
Idea #3 (Calculus)
Calculus teachers should fall in love with this software! Probably the most famous examples of derivative relationships are the relationships between position, velocity, and acceleration. Literally, any scenario with non-constant motion can be used to explore these relationships. I’m partial to making marble catapults and filming the path of the marbles. Students then use Tracker to model the marbles’ vertical height, velocity, and acceleration. We then verify that acceleration is the derivative of velocity and that velocity is the derivative of position using graphs, equations, and numerical data generated by Tracker. These ideas are just the tip of the iceberg for Tracker! Since the software just requires a video as input, the use-cases are essentially just limited to your imagination and what scenarios you can get on video! If you would like written step-by-step directions, keep reading! If you’re a visual learner, we have you covered at our YouTube channel.
Step 1: Download and install the software
If you are a first-time user, the software will have to be downloaded and installed. If you navigate to the URL physlets.org/tracker you will be greeted with this homepage:
Right at the top of the page, you can see some hyperlinks to download the software for either Windows or MacOS. Just a reminder that this homepage looks like the software is geared for physics teachers, because it is, but that doesn’t mean other STEM fields can’t also make good use of the software! Once you download the software, you will be prompted to install the program via the usual installer wizard. You will be asked if you want to install the example tracker files. While this will take up slightly more space on your computer, I recommend doing so, as these provide a great way for new users to see some of the features of the program not covered in this blog. Once you have gone through the installation wizard, Tracker should be installed on your computer and ready to go!
Step 2: Capture Some Math in Action!
Now that Tracker is installed on your device, we need to capture some mathematics in action. For our example today, I had students record me running a variation of a 5-10-5 drill to investigate the concepts of displacement, velocity, and speed. The 5-10-5 drill is a drill used in athletics in which an athlete starts from rest, runs 5 yards in one direction, turns and runs 10 yards in the opposite direction, then turns again to finish where they started. The video you record, or have your students record, will depend on the mathematics you wish to explore. The video process is fairly straightforward if you have any experience recording with a smartphone or similar device. There are just a couple tips and tricks to keep in mind when videoing for a tracker project:
- Tracker needs to calibrate itself for distances. Thus, it is always a good practice to have a stationary object in the video that has a known length, or at least include a length that you can measure.
- You will be setting an origin point in your video that needs to be stationary. Make sure that you move the camera as little as possible when videoing so as to not disturb the future origin point.
With these two points in mind, you can simply record the phenomenon of your choosing just like any other video you would shoot with your smartphone or similar device!
Step 3: Upload a Video
Now that you have Tracker installed on your device and a video that is ready to be “tracked,” it is time to take the video from your smartphone and load it into the software. There are several ways this can be done, but if you have a stable internet connection, the easiest way (in my experience) is to upload your video to Google Drive so that you can download the video on the device of your choosing. If you are not a “Google School” or you do not have a good enough Wi-Fi connection to upload a video, you can always use a charging cord and upload the video directly. Once the video has been transferred to the device in which Tracker is installed, the video must be loaded into the software. When you initially open tracker, you will see a screen like you see in the image below:
Go to “File” in the top-left of the screen, then “Import,” then “Video…” Navigate to the correct video file and open the video. The video selected should import into the main Tracker window. The two windows on the right side of the screen will remain blank until we complete the initial setup of the Tracker project.
Step 4: Prepare the Video for Tracking
With a video uploaded, we have just a couple steps to complete before we can begin to gather meaningful data. The first necessity is to define an origin and positive direction for our video. Without these, it is impossible to get quantifiable data.
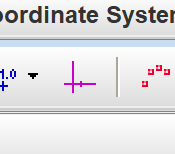
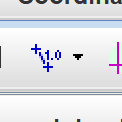
To set an origin, select the button that looks like a coordinate axis on the top toolbar. Once selected, a coordinate axis will appear overlaid on the video in the main window. Click the middle of the coordinate axis and drag it to where you want the origin to be. For my example, I will choose my starting location as the origin. You will also notice a “hash mark” on the horizontal axis. This denotes the positive direction. You can click and drag the hash mark to change the orientation of the axes and the positive direction of the coordinate system. When your origin is set, your video should look similar to the image below.
Once an origin has been set and a positive direction has been chosen, the video needs to be calibrated. This gives the software a sense of scale so that it can calculate distances, speeds, accelerations, etc. accurately. Find an object or length in the video of a known distance. We will mark that distance with a “calibration stick.” The Calibration Stick icon can be found on the toolbar next to the coordinate axis button. Select the Calibration Stick icon, then “New,” then “Calibration stick. With a calibration stick on the screen, you can click and drag the ends of the calibration stick so that it runs the exact distance of the known length you are using to calibrate the video. In the case of my example, I had two students stand with meter sticks exactly 5 yards apart. This may be a good time to mention that you can zoom in on your video using the scroll wheel of your mouse. This will help you be more precise with your calibration. Once the calibration stick is set to your satisfaction, double click the existing value for the calibration stick (it should default to 1.00 m) and change the value to the correct quantity and unit. Once you are finished calibrating, your screen should look like the example below.
Step 5: Tracking the Action
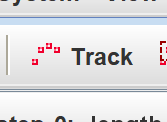
With our set-up complete, we have one more tedious task. We must now “track” the subject of our video. In the case of my example, I am tracking myself running the 5-10-5 drill. To begin the process, we go to the “Track” button in the toolbar (shown below) and select “New,” then “Point Mass.” Once a point mass is active in the software, something interesting happens: the side windows should now be populated! The top window should have some, as of now, empty graphs, and the bottom window should have an empty spreadsheet. We are now ready to “track.” Hold down shift and you should see your cursor change into a rectangular crosshair. Before beginning, I should note that it is important that you track the same point on the object throughout the video. The better your tracking, the more accurate your data will be at the end, so it is worth your while to zoom in and track precisely! Given that in our example I am tracking myself running, I will attempt to click on my center of mass (belly button). Once you click, that data point will be recorded and the video will go forward one frame. While holding shift, find the same point on your object and click again to record another data point. Repeat this process until you have a data point for every frame in your video. You should notice that as you “track” your object, the graphs and spreadsheet update in the side windows!

Step 6: Using Tracker to See the Correct Data
Once the tedious task of tracking your video is completed, the real fun begins! If you direct your attention to the side windows, you can change the spreadsheet and graphs to see just about any quantity you could care to see. Personally, I only like seeing one graph at a time, so my first order of business is to click “Plots” in the graphing window and change the number of plots to “1”. This gives a nice, big graphing window to look at.
By default this graph will show x-position versus time. However, if we click on either axis label, we can change the quantity being graphed on that axis. You may wish to look at y-position versus time. Or x-velocity versus time. Or x-position versus y-position. The possibilities are nearly endless given all the quantities Tracker has available!
Tracker can compare nearly any two quantities you like! Above are examples of velocity and acceleration versus time graphs.
The spreadsheet is equally flexible. By utilizing the “Columns” button in the spreadsheet window, we can check or uncheck columns that we wish to see. Thus, students can see the physical phenomenon develop in real time in the video window; they can see a graphical representation in the graph window; and a numerical representation in the spreadsheet window!
Step 7: Digging Deeper
This blog is only meant to be an introduction to the software, so I will not go into every feature that Tracker offers to analyze data, but I would be remiss not to mention one more feature that really allows students to dig into the data. Right-click on the graph in the graphing window, and select “Analyze.” A second window will pop up displaying the graph currently displayed in the graph window and the associated data in spreadsheet form. I’ve used the analyze feature for the x-position versus time graph in the image below.
The Analyze feature is a powerful tool for students wishing to dig further into their data. Notice in the top left of the window there are two tabs: “Measure” and “Analyze.” The “Measure” tab allows you to find the slope (derivative) of the curve at a given point as well as find the area between the curve and the x-axis over a selected interval.


On the left we can see the slope of the curve at the indicated point is zero. The right graph indicates an area of about 8.08 units under the curve from t=0 to t=4.
The strength of the “Analyze” tab lies in the “Curve Fitter” option. This tool allows students to fit their graph with a best-fit curve. Tracker gives a few pre-set functions such as Line, Parabola, Exponential, Sinusoid, etc. but you may also create a custom function. Since the example I’ve been demonstrating closely resembles a sinusoidal function, in the image below you can see I have chosen to fit my graph with a sinusoidal curve. Tracker automatically creates the best-fit function for the selected curve. As you can see in the image, in my example Tracker created a function of the form x = Asin(Bt + C) and gave the values of the A, B, and C parameters on the right.
Wrapping it all up
This step by step tutorial hopefully has given you an idea of how to navigate some of the features of this powerful program. As I have alluded to throughout the tutorial, this is not meant to be an all-inclusive manual of everything Tracker has to offer, but a quick overview of some of the features I use most often. Once you feel comfortable with these base features, my #1 advice would be to just get in the software and just play! If you are anything like me, initially you’ll be surprised at how much Tracker can do, and then, you’ll eventually be surprised if there’s something Tracker can’t do!
Resources
Please login or register to claim PGPs.
Alternatively, you may use the PGP Request Form if you prefer to not register an account.
